User guide
Help for filling in surveys
With the PARTIMAP map-based survey tool you can give your opinion by using map markers in addition to the traditional questionnaire questions. The following description will help you in how to do this.
To proceed, you must accept the terms of use and the privacy policy on the landing page of the questionnaire. You can navigate between the worksheets by using the blue forward and back buttons at the bottom (). The completion of worksheets containing traditional questionnaire questions corresponds to similar interfaces. Follow the instructions and answer with text, number, or by ticking the number of checkboxes required or by entering your own answer.
All questions marked with an asterisk (*) must be answered, otherwise you cannot move on to the next worksheet or submit your answers.
If the owner of the questionnaire has allowed everyone to see statistics on the responses, then after providing your answers, the worksheet will show the results so far for those given questions. Click on the next button again to go to the next worksheet.
Browsing and rating map items
In some worksheets, you can browse through the elements drawn on the map. Click on the grey map button () in the bottom right corner of the map to switch between base maps (e.g. black and white, satellite, topographic or route backgrounds). Click on the zoom in and zoom out icon () or zoom in and out with two fingers to set the appropriate scale.
Items may have a description, which can be read by clicking on the item on the map or by clicking on the Map items drawer in the sidebar.
If the questionnaire asks you to rate elements of the map, you can do this in the sidebar's drawers.
- Rating with stars: following the instructions, you can rate the item on a scale defined by the number of stars.
- Like/dislike rating: you can give the item a positive () or negative () rating.
If the owner of the questionnaire has allowed everyone to see statistics on the responses, then after providing your answers, the worksheet will show the results so far for those given questions. Click on the next button again to go to the next page.
Mobile view
If you are completing the survey on a tablet or mobile phone, you can switch between the sidebar with questions and instructions and the map view with the hide () and unlock () buttons. Clicking on the highlighted items on the map will, after a slight delay, display the description and rating option for that item.
You can go to the next page at the bottom of the open sidebar.
Drawing on the map
Always try to be as precise as possible in the positioning of the markings. If necessary, use the scroll wheel on your mouse, the +/- keys or two fingers to zoom in on the map.
Plot point
The survey owner expects you to mark specific locations on the map.
This can be done by clicking on the white pin on a red background () next to the instructions in the sidebar. Then click on the location on the map that you want to mark according to the instructions. You can place the point by clicking once, then in the dialogue box on the right you can add a reason for the marked location.
You can save the selection by clicking Save or delete it by clicking Delete Item. You can then add another marker to the map.
Draw a line
The survey owner expects you to mark something on the map with a line segment.
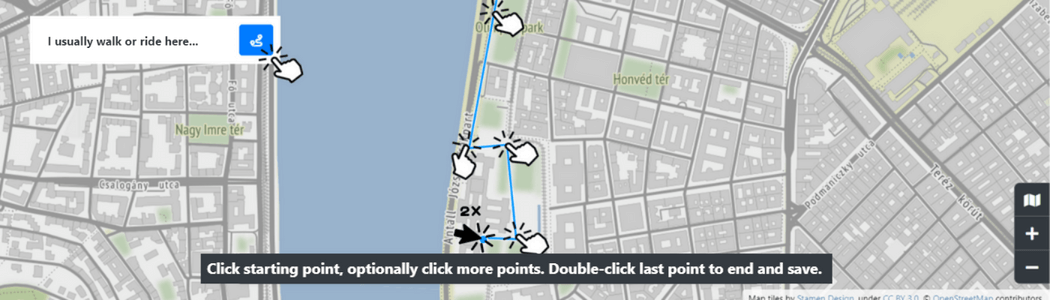
You can do this by clicking on the white line on a blue background () next to the relevant instruction in the sidebar. On the map, click once to place the start point of the line, and then click again to mark the intermediate points of the section. Finally, double-click the end point to end the line.

After closing the line, you can add a reason for the selected item in the dialogue box that opens. You can save the selection by clicking Save or delete it by clicking Delete Item. You can then add another marker to the map.
Mapping the area
The survey owner expects you to select an area that is relevant to the question asked.
This can be done by clicking on the white outline on a green background () next to the relevant instruction in the sidebar. On the map, click once to place the start point of the shape, click again to select the boundary points, and then click again on the starting point to close the area.
After closing the area, you can add a reason for the selected item in the dialogue box that opens. You can save the selection by clicking Save or delete it by clicking Delete Item. You can then add another marker to the map.
When you have finished adding elements, you can move to the next page by clicking the blue arrow at the bottom of the sidebar.
Help to create a survey
Below is a description of how the admin interface works.
ⓘ If you need any further assistance, please contact us at hello@partimap.eu.
- Registration
- Create new survey and manage previous ones
- Survey data sheet
- List of worksheets
- Worksheet types
- Create maps and manage history
- Report and results
- Tips for making a questionnaire
Registration
After registration, anyone can use the app with full access to its functions and free of charge. PARTIMAP is currently available in Hungarian, English, German, Lithuanian and Spanish. You can switch between languages by clicking on the button in the top right-hand corner (). If you would like to use the program in another language and help with translation, please contact us at hello@partimap.eu!
In the admin interface, you can create new surveys, modify previous ones (Surveys) and edit maps related to surveys (Maps).
Create new survey and manage previous ones
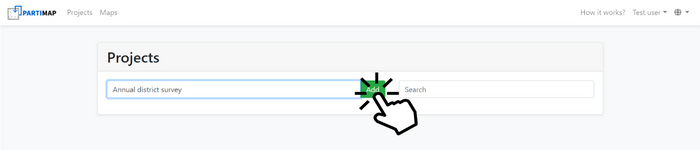
A new survey can be created by entering the survey name on the Surveys page after logging in and clicking on the Add button.
In the Surveys menu you can find a list of your own surveys. Here you can see the number of views and responses, and by clicking on Download report you can download the report generated from the completions in .xlsx format.
There is a ⋮ button next to each of the surveys that allows you to Delete the ones that are no longer needed. By selecting Duplicate, you may replicate and publish your survey without the dummy responses of the testing phase. By clicking "Transfer to another user”, questionnaires can also be shared for editing with another registered user.
Survey data sheet
From the Surveys menu, click on the survey’s name in the list or create a new survey to go to the survey details page. The data, questions and content related to the survey can be entered in the survey data sheet after the survey has been created.
It is divided into two parts: the top part of the page provides general information about the survey and the second part allows you to edit the worksheets.
In the related data and settings you have the option to
- enter the name of the survey, which will appear in the browser page title and when sharing on social media, in addition to the admin interface;
- edit its path (URL -
https://partimap.eu/p/*), - set password protection to restrict who can fill it in. In this case, navigating to the URL of the questionnaire will prompt for a password, which then can be used to complete the questionnaire. If you don't want to receive any more completions, you can also set the questionnaire to inactive by setting a password;
- add a unique meta description (preview text) for Facebook sharing,
- upload a unique image for Facebook sharing;
- provide the contact details of the data controller, which will appear in the privacy statement;
- provide a unique thank you message and a link to continue navigation (Next URL) at the end of the completion (after submission) and to turn on/off the buttons (Facebook, Twitter, email) at the end of the completion inviting the respondent to share the survey;
- ask for individual (hourly) or daily email notifications about submissions
List of worksheets
The survey is divided into worksheets. In the editing interface of each worksheet, you can set up different questionnaire questions, informative texts and map elements prompting interaction from the respondents.
Worksheets can be edited under the general survey settings. In case of a new survey, this section is empty, and you can start editing the survey content by clicking on the Add Worksheet button. A list view of already created worksheets is also available here.
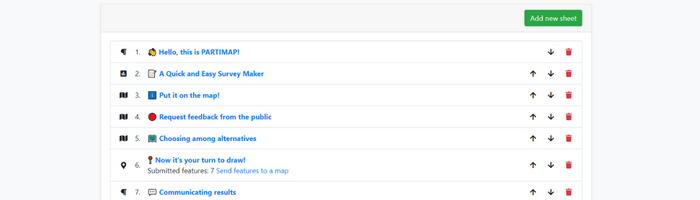
If there are already several worksheets in the survey, the up and down arrows can be used to change the order of the worksheets, and the trash can icon deletes the unnecessary worksheet.
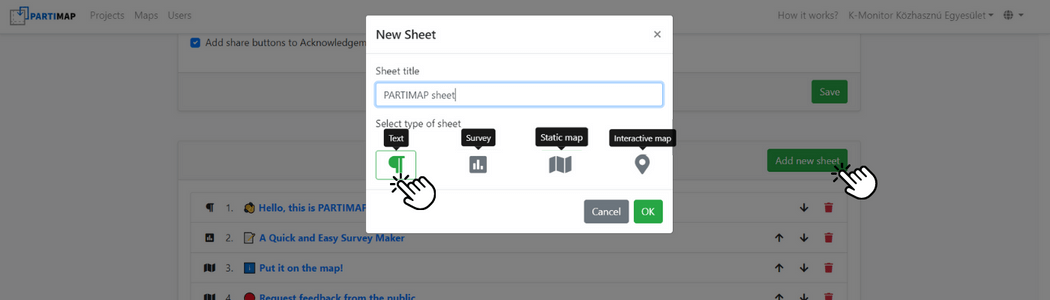
You can select the type of worksheet (Text, Questions, Questions and map or Map tasks) by clicking on the pictograms.
In the first worksheet, respondents must accept the terms of use and the privacy policy. As a first worksheet, it is useful to provide a Text worksheet where the scope (e.g. expected length of the survey) and purpose of the survey can be clarified.
By clicking on the View button in the top right corner of the Survey Data Sheet, you can go directly to the questionnaire being built, tracking the changes you have saved. When editing the questionnaire, it is a good idea to track changes here in parallel with the editor interface.
Worksheet types
Similarly to the questionnaire, in the editing interface of the worksheets you can also step with the blue buttons among the worksheets under editing. Clicking on ↗ we can jump directly from our worksheet to the sheet visible to our audience. From the worksheet editing interface, you can also go back to the survey sheet by clicking on the PARTIMAP icon (Back to survey) in the top left corner.
To save your changes, press the Save button, and a pop-up window will warn you when you navigate to another page.
Text worksheet
A worksheet with text and images, which can be used to describe, among other things, the objectives of the survey, the activities of the organisation or institution carrying out the survey, the background to the decision situation. They can be provided when editing the worksheet:
- The Worksheet title, which will also appear in the public questionnaire;
- The Worksheet description, which is the main text of the dialog box that appears. The text can be customised with basic formatting options, with the possibility to insert a link or image (by providing an external source link);
- Your background image, which fills the space behind the dialog box;
- Buttons to Share page on social media.
- Quiz mode, which, when enabled, allows respondents to move between worksheets only if the administrator grants permission.
To save your changes, press the Save button, and a pop-up window will warn you when you navigate to another page. The blue right/left arrows at the bottom of the page are used to navigate between the worksheets under editing.
From the worksheet editing interface, you can also go back to the survey sheet by clicking on the PARTIMAP icon (Back to survey) in the top left corner.
Questions worksheet
The Questions worksheet allows you to create traditional questionnaire surveys. They can be entered when editing the worksheet:
- The Worksheet title, which will also appear in the public questionnaire;
- The Worksheet description, which appears at the top of the dialog box. The text can be customised with basic formatting options, with the possibility to insert a link or an image, similar to the Text worksheet. By adding an image, it is possible to condition questions on the image;
- Questionnaire: for the worksheet, here is the possibility to add questionnaire questions, whose properties are editable in the dialog that appears;
- Show response statistics to the visitor after completion: if checked, after continuing to the next page, the visitor is shown a simple aggregated statistics of the responses so far in a bar chart;
- Display results only: if checked, the worksheet questions are closed, no answers are collected anymore. In this worksheet, only the results of previous responses will be visible to visitors. This gives you the opportunity to convert the closed survey into a survey displaying the outcome of the survey while maintaining the same link;
- Supply background image, which fills the space behind the dialogue box;
- Buttons to share the survey. This is useful for the last worksheet, which often contains demographic questions.
The following question types can be added to the Questions block by specifying Question text:
Text answer: a text box allows the respondent to type in any answer. The result report will include this text response.
Numeric answer (typing): the field can be filled in by typing a number. You can set the minimum and maximum value of the answer that can be given. The report contains the answer in numeric format.
Numeric answer (with slider): here the respondent can set a numeric answer without typing, using a slider. Here you can also specify the minimum and maximum value of the answer. The two extremes can also be named in text, which will appear on both sides of the slider in the questionnaire, forming a scale. The report contains the answer in number format.
Checkboxes: In the Options section, click on the New option button to enter any number of response options, to which the respondent can individually respond by ticking the box. The maximum number of answers that can be selected can be set. By ticking the Add Other option box, an Other... option will be added to the list of answers, allowing the respondent to enter their own text response to the question. The report will contain the name of the selected answer options and the other answer given, separated by semicolons.
Multiple choice: In the Options section, clicking on the New option button allows you to select any number of options, from which the respondent can choose one. The report contains the name of the response option in text form.
Dropdown (one can be selected): like the multiple-choice, the respondent can select one of the given Options from a drop-down list. In addition to the Options, you can also specify an Other... option. The report will contain the name of the response option in text form.
Star rating (5 stars): the respondent can give a rating of 1 to 5 stars on the question by simply clicking on it. The report contains the answer in number format.
Multiple Choice grid: similar to the multiple-choice question type, but multiple rows can be entered, for which the respondent is asked to select one of the answer options (Column). Any number of rows and columns can be entered for the question. If a response is mandatory, an option must be selected for each row. The report will contain the name of the response option in text form, broken down by line.
Checkbox grid: Like the checkboxes question type, the respondent can select more than one response option for a row, which can be set by clicking on the New column button. You can add any number of rows and columns to a question. If a response is mandatory, at least one option must be selected for each row. The report will contain the names of the answer options in text form, separated by semicolons.
Allocate units (weighting): this question type asks the respondent to distribute a given number of units (Number of units to allocate), which can be specified in the question text, among the options given. The respondent has to allocate all units. The report will contain the values per option. The question type can be used to accurately assess (weight) the importance of different areas, topics or issues.
Each question can be made compulsory by ticking the Request to be answered box, without which the respondent will not be able to proceed or submit your answer.
By ticking Add responses to map markings for analysis purpose you can add the answers as parameters to the markings of the map, if it belongs to your survey. Thus the text of the added questions and responses will be available among the elements of your .kml file, named as partimapQuestion(...). In this way you can filter the responses – which were added to the map – by sex, age, etc, as long as the questionnaire contains questions referring to them.
You can also make the display of certain questions dependent on their previous responses to another questions by ticking on the Show only if… checkbox. Please note, that the question which sets the condition (⮢) must precede the Conditionally visible (⮥) question and the order cannot be changed. You also won’t be able to delete the questions with the (⮢) later or edit their answer options.
With these kind of questions you can optimize the length of the survey – eg. if you have some questions regarding car usage, these questions will be visible only to those, who stated in the previous question (⮢) to have access to a car.
In the Questions block (the list of questions) of the worksheet editing interface, questions can be deleted by clicking on the trash can icon, moved to another worksheet using the two-way arrow, or rearranged by clicking on the question tab and dragging it.
Questions and map worksheet (static map)
The worksheet can be used to create a map-based survey that can be used to present a completed development or plan, and to collect evaluations and feedback on it. Here, respondents are asked to answer questions related to what they see on the map, but unlike the Map with tasks worksheet, they are not allowed to draw on the map.
When creating the Questions and map worksheet, you can import the map content from an existing map stored in the Maps menu (Copy map elements from here) or upload it directly from an external source (e.g. Google Maps) using a .kml file. For more information on moving the map, see the introduction under the subsection on Maps. By setting the boundaries of the map, we can specify the area within which the user can move and zoom in on the map.
Elements that can be defined when editing the worksheet:
- The Worksheet title, which will also appear in the public questionnaire;
- The Worksheet description, which appears at the top of the dialog box. Here it is worth explaining concisely what the respondent is expected to do on the worksheet. The text can be customised with basic formatting options, and there is also the possibility to insert links and images.
- Questionnaire: it is also possible to add questionnaire questions here for the whole worksheet, which can be edited in the dialog box, similarly to the Questions worksheet. The questionnaire questions are displayed in the sidebar below the description for those completing the survey.
- Show response statistics to the visitor after completion: if checked, after continuing to the next page, the visitor is shown a simple aggregated statistics of the responses so far: both the results of the worksheet-level questionnaire questions and the average of the scores assigned to the items.
- Display results only: if checked, the worksheet will not collect responses, only the statistics of the responses will be displayed to the respondent.
- Map tasks for respondents: if Rating fixed items is checked, respondents can rate the items displayed on the map. Two types of rating can be selected:
- Stars: the respondent can rate the item with stars by clicking on the item. The number of stars can be set (1-10), but if a single star is selected it can be used as a yes/no answer. The rating does not include a worksheet level question, the instructions for this must be provided either comprehensively in the worksheet description or individually in the item description. If the response statistic is set, the average number of stars and the number of ratings will be displayed for the items after continuing to the next page -- this is shown by default in the admin interface.
- Like/dislike: the respondent can give items a positive () or negative () rating. If the response statistic is set, the number of positive and negative ratings will be displayed for the items after continuing to the next page -- this is shown by default in the admin interface.
- The report displays the ratings data in a separate Ratings worksheet, which includes the respondent ID used to associate the rating with other responses, the name of the rated item, and the rating in number format (number of stars, [1, -1]). In addition, the generated report also displays the total number and average of ratings in an Aggregated Ratings worksheet.
- Default basemap: Here you can set the basemap that will be displayed behind the elements drawn on the map (e.g. road network, satellite, black and white, cycle paths, topographic, etc.). Respondents can change the display themselves.
- Map Elements: The elements drawn on the base map are displayed here. The content that is displayed to respondents when they click on the element or drawer can be edited in the element drawers. In the item drawer, you can set name, colour, size, style, extra stroke, label and picture description.
- By filling in the Category field, map items can be filtered by respondents for that category. By setting a category, different elements can be separated and more easily analysed.
- By checking Hide item in list, the item will appear on the map, but cannot be interacted with: it will not appear as a drawer among the Map items and cannot be clicked on in the map. This is useful when drawing an auxiliary element on the map that only orientates the respondents, e.g. the boundary of a city.
- Using the KML buttons above the element list, it is possible to load a map created in another editor interface () or to download map elements ().
You can also use the point, line and area buttons in the top right corner of the static map worksheet's editing interface to draw elements directly onto the map displayed on the worksheet. Any number of elements can be drawn on the map. You can zoom in on the map by using the +/- buttons or by using the two-finger zoom function.
Drawing a point (red): click on the white pin on the red background to place a point marker. The marker can be placed with a single click.
Draw a line (blue): Click on the white line on the blue background to draw a line. Single-click to place the start point of the line on the map, click again to mark the intermediate points of the line and double-click to mark the end point.
Draw area (green): Click on the white outline on the green background to draw an area (polygon). Click once to place the starting point of the shape on the map, click again to mark the boundaries, and then click again on the starting point to end the drawing.
Label on map: you can add text labels to all of the drawn elements. It’ll fit the size and color of the specific element and, if you zoom out, it'll disappear after a while. The label can also be rotated and follows line break. Emojis can be added to it as well. With labels we can place explanations, numbering and icons helping our respondents.
Mobile view: If you are using the editor interface on a tablet or mobile phone, you can switch between the question panel and the map by pressing the hide (<<) and open (>>) buttons for map worksheets. The drawing buttons are available in the map view by hiding the sidebar.
Map tasks worksheet
In this worksheet, respondents can enter their answers by drawing on the map. The title of the Worksheet title and the Worksheet description should contain information that will help the respondents to give an accurate answer to the question asked.
The Respondents Interactions menu allows you to define the tasks given to the respondents in the worksheet. This means drawing an element (dot, line, area) and answering additional questions related to it. The number and type of tasks can be unlimited, so you can define two tasks requiring drawing a dot.
Click on the + New map task button to define the exact task in the pop-up window:
-
You can choose the type of element to draw.
-
The Task Unique Name is a short definition (e.g. Walkway, Good Place, Bad Place) to identify the markers for the task in the report, and this is the default name for the plotted items.
-
Instructions for drawing an [item]: the text you enter here is displayed in the map's sidebar next to the button for the task, and is also visible to the user during the marking process.
ⓘ e.g. Which is your favorite place? [point], How do you get to work? [line], Where would you like to see more green space? [area]
-
Number of items (max): the maximum number of items that can be added to the task. If they reach this number, they will be notified.
-
Color: You can specify the color of the button, text bubble, and drawing element for the task.
-
Naming the drawn items: by ticking the checkbox, it becomes part of the task for the filler to name the drawn item. This and other related tasks will appear after drawing.
-
Add a checkbox question: by ticking the checkbox, you can add a question to the exercise with an optional number of other possible answers. This question helps to analyze the map answers, as it allows us to filter out some attributes related to the mapped situation (e.g. what time of day, what vehicle, etc.) without the uncertainty of the textual answer.
-
Add a text question: by ticking the checkbox, you can add a text question to the drawn element to ask for interpretation or justification of the marker.
-
Show only if...: This allows you to make the tasks conditionally displayed on the basis of the response given to a questionnaire question. If there are no other tasks on the worksheet, it will not be shown at all to those repondents to whom the condition does not apply.
Using a routing, you can show the maps tasks only to female respondens, or those using a certain bus route on a daily basis.
After setting the above parameters, click on the Save button to complete the task. Click on the task name to edit or delete the task later.
In the lower half of the sidebar, the Map elements contain a list of elements added (drawn or uploaded) in the admin area, similar to the static map.
ⓘ As with the static map, you can draw elements on the map to orient the fillers. For example, you can use them to indicate the area or zones within which you expect the elements to be drawn. It is also useful because the map will automatically zoom in on these elements. The label for the item will still appear on the map, but the description will not appear in the sidebar drawers, but in the map window that opens when you click on the item.
If elements drawn by fillers have already been submitted to an interactive map, they can be exported to a personal map by clicking on the Send features to a map button next to the worksheet in the list on the project sheets, where they can be browsed, edited or downloaded in .kml format for external use. The .xlsx report also contains the data of the submitted elements (fill identifier, coordinates, description). If you do not want to download the responses collected in a given state, but just browse through them, you can click on the blue button (👁) next to the interactive map worksheet in the list of the survey sheets to view or download the submitted items. In the interface, items can be filtered and deleted by the category derived from the responses. When downloaded, the filtered items shown on the map will be exported. Deleting does not modify the stored responses.
Create maps and manage history
In the Maps menu, you can store and edit your own map drawings (.kml format shapefiles). Here you can collect and edit maps of the user's city and its surroundings that have been created previously, and the answers collected from questionnaires. Using .kml format files, it is easy to export the elements stored here to external map editors and import maps from there into PARTIMAP. It's also easy to move between the Maps menu and surveys: you can move the contents of your own maps to worksheets (Copy map elements from here).
PARTIMAP does not currently offer graphical analysis functions, but you can edit individual elements on your own map: in addition to their name and description, you can customise their appearance (colour, size, line style in the case of lines).
To create your own new map:
- On the Maps page, enter the name of the new map and click on the Add button. Here you can load data from a .kml file in the editor interface;
- From the submissions of a survey's respondents, with the Send to New Own Map button in the row of the corresponding worksheet on the survey data sheet.
You can edit the following details of your own map in an interface similar to worksheets:
- Name of map
- Map elements: objects drawn on the base map are displayed here. Using the KML export/import buttons at the bottom of the page, you can import a map created in another editor interface to the base map and save the map elements in .kml format.
The .kml file containing the PARTIMAP survey completions contains the type of markers as a category, so you can use an external analysis program or convert the .kml file into a spreadsheet to separate the different markers and edit the parameters of the items.
The .kml files generated and used by PARTIMAP use the following parameters, which also provide interoperability with Google Maps:
- The x and y coordinates of the points that make up the elements;
- The element's serial number (gid) and name (Name);
- The category assigned to the element (partimapCategory);
- The style of the line or area boundary (partimapLineStyle), the size of the point (partimapPointSize) and other parameters (size, colour) automatically read by Google Maps (ExtendedData);
- The content of the description field used by PARTIMAP (partimapDescription);
- The added questions and responses with the option of Add responses to map markings for analysis purpose (partimapQuestion)
- More information about this is available on the survey's Github page.
Report and results
You can download a survey in .xlsx format from the Projects list view page. The report contains the results in the format detailed earlier. The map elements can be linked to the answers to the survey questions, such as the demographic data of the respondents, by means of identification numbers. Once the data are linked, the spatial markers can be analysed in more depth, filtered along each group of respondents. The report includes the type of the tool used by the respondent (pc/smartphone) as well as the IP address.
Tips for making a questionnaire
Before we start to compile the questionnaire, we need to be clear about the decision or activity we want to ask respondents to support. It makes sense to focus on one topic, since if the focus of the questionnaire is too broad, the answers will be less accurate and respondents may be discouraged if they have to answer too many questions or questions that are not relevant to them. If properly focused, target groups can also be more easily identified and reached.
Plan who you want to reach with your questionnaire and how!
A questionnaire about playgrounds, for example, should be sent to a Facebook group for local mums, but if you want to ask local young people about an issue that concerns them, you should reach them through platforms or institutions they use on a daily basis.
Focus on the more hard-to-reach social groups. Online questionnaires tend to reach young or middle-aged respondents with higher incomes and education. However, with proper design and different (even offline) tools, we can ensure that everyone has the opportunity to express their views. Let's put the paper questionnaire in the library, put a QR code pointing to the questionnaire in community spaces, encourage NGOs to share the questionnaire with their clients and followers!
It is also worth being aware of what data is already available on the topic you want to map. Don't ask questions that we already know the answer to or can easily find out without asking!
The questionnaire should be concise!
As a survey is conducted, new ideas on the subject emerge, and more and more details are sought. However, respondents are not as committed and may drop out if they see a longer survey. We recommend that you use no more than 6-8 worksheets in a survey. Measure the time it takes to complete a survey, and make it no longer than 10-12 minutes!
Please indicate the estimated completion time on the first worksheet of the survey. If the number of people completing the survey is far below the number of views (e.g. only one in ten views will result in a full survey completion), your survey is probably too long.
Try to give a precise explanation of the tasks, highlighting the text, using emotive icons, and as concisely as possible!
Review your work!
Due to the complexity of a survey consisting of several worksheets with a series of questions and information, mistakes and typos can slip through despite all the care and attention. If the wrong questions are asked, the answers will be useless.
In parallel with editing the admin interface, you should track the changes on the public interface. Changes made in the editor are updated in the public interface after saving. Once the survey has been launched, the questionnaire should only be modified if justified, as the results of the modified questions will not be comparable with the answers to the previous versions. Check the results received to see if they can be analysed and used for the intended purpose.
Prepare the structure of the incoming data!
Once you have received a sufficient number of responses and the campaign has ended, you will have to process the data received. Think in advance about the type of responses you expect, the format, interfaces and tools you plan to use to present the results.
- It may be a good idea to use open-ended, expository questions, but it is not a good idea to ask more than 1 or 2 of these in a questionnaire. Open-ended questions are also more demanding for the respondents to answer, and it is much more difficult to analyse text responses when processing the data than if respondents were to choose from the options provided.
- PARTIMAP allows for the possibility of accepting other responses from respondents to a question with a multiple-choice or a fixed number of options. This makes most open-ended questions redundant. However, at the end of the questionnaire, it is worth giving the respondent the opportunity to write down in text any aspects of the topic that were left out of the questionnaire.
- For multiple-choice questions, it is important that the options are clear and distinguishable. The difference between "Rarely" and "Sometimes" may not be obvious to all respondents.
- For all types of questions, it is crucial that the question asked is not suggestive and does not influence the respondents, as this will lead to biased results.
- Do not ask two different questions within the same question and avoid similar or repetitive questions as this can also discourage respondents.
- You can make some questions compulsory if you think the answers to them are important, but too many compulsory questions will lead to drop-out.
- In the map interaction, you should always encourage respondents to provide meaningful textual justifications, without which you can only guess why the place on the map is marked!
- In most cases, it is important to collect socio-demographic data (age, gender, income, education level), as this will help you to determine who your respondents were, whether they were representative of the whole population concerned or only constitute a narrow group of respondents. However, collect personal data only to the extent necessary and be clear about how it is used (in line with the terms of use). If you publish data, you should hide any personal, sensitive data (e.g. data provided in a text response, place of residence marked on a map).
- Set target completion rates before launching the survey and track how many responses have been collected. If you fall short of the targets, make further efforts to disseminate the questionnaire.
Make your questionnaire unique and recognisable!
Under Users, you can enter a mini logo and web address for your profile, which will then appear at the top of each worksheet, indicating who the owner of the questionnaire is. You can also customise the worksheets with individual background images. We can also apply the colour of our brand instead of the default blue colour of PARTIMAP. Keep it simple, clean and coherent!
You can also place images in the description fields, but you need to store the image on an external repository or find a copyright-free, freely usable illustration. These can make the decision more tangible for the person filling in the form.
You can colour the points and lines of the static map worksheet to match the colour of your organisation. You can also add descriptions and images to the map elements, making it easier to identify the places you have marked.
You can add your own url and Facebook share options to the questionnaire in the survey's editor interface. This is important as the easiest way to distribute the questionnaire is through social media. If you add Facebook preview details after the questionnaire has been shared, the preview will not be updated to the one you have set. If this is the case, it should be indicated to Facebook, who will then update the image and title.
The questionnaire can be embedded on your website by placing the following code in the HTML code of the page, with the link to the surveyin the appropriate place.
<embed src="https://partimap.eu/en/p/demo" style="width:100%; height:550px;">
The width and height of the embedded element can be adjusted.